NSW Beach Profile Database
This page is dedicated to explaining how the inbuilt analysis tools on this site work. To use the tools, select a beach on the NSW Overview page and select the profiles relevant to you. The buttons 'Cross Section', 'Contour Timeseries' and 'Volume Timeseries' will give you access to each of the tools in turn. For practical examples of uses of these tools, see here.
For examples of the data in use, visit the reference page.
Most of the data you are accessing on this site has been processed using photogrammetric techniques, to give points along selected profiles along the NSW Coast. Along the profile lines, the photogrammetrist has chosen the points where the slope of the surface has changed. Typically, there is 10 - 20 points per profile at any given survey date. In some instances data have also been sourced from ground survey or Airborne LiDAR (Light Detection and Ranging) survey.
If you want more information on photogrammetry, see the reference page to get information on the accuracy of the data as well as examples of the data in use.
The profiles are in a fixed position along the beach, which can be selected on the map display. The profile will turn blue when it is properly selected. To unselect a profile, click on the profile on the map again, or click on the profile in the list on the left hand side of the page. The profile will return to red when it is successfully unselected.
The most simple tool available simply plots the profile data. The plots show elevation on the y-axis and chainage on the x-axis.
Elevation: the height above the Australian Height Datum (AHD) in metres.
Chainage: this refers to the distance, in metres, from the arbitrary starting point of the profile, which is stationary through time.
This tools is for visualising the data. It shows how the profile has changed over time. While it is possible to view as many profile as you want, it is generally only meaningful to compare one profile at a time.
The contour timeseries provides an analysis of the location of a chosen elevation contour on a profile throughout time. By default, the contour chosen is the 2 m AHD
contour, although this can be changed. Higher elevations can be used to examine changes in dune or escarpment location.
This will give an indication of long-term accretion/recession trends on the on the beach. The plot shows the chainage of the
contour, and the year of the survey.
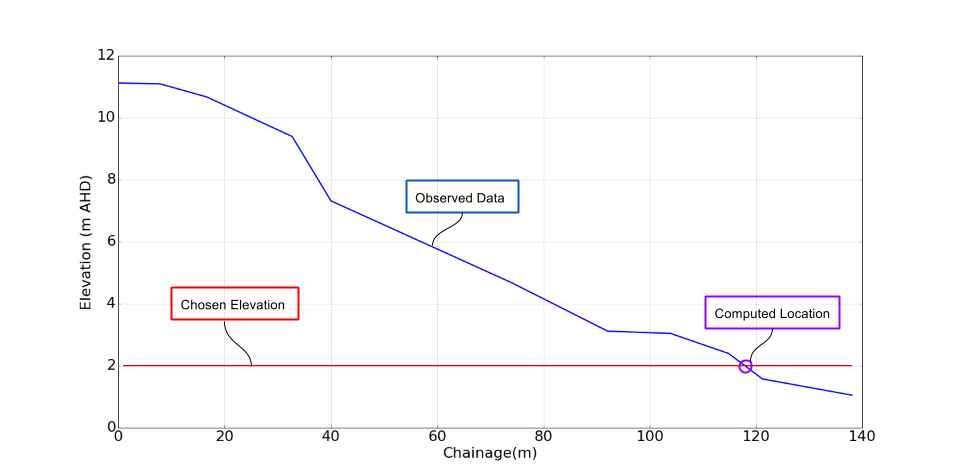
This tool utilises linear interpolate between survey points to provide a chainage with the required elevation (click on the image to enlarge). However, it will not perform any extrapolation.
This means if you choose a contour below the minimum height of the survey, no value is returned. Be sure to look at the profiles to assess the suitability of a contour.
Typically, the data will extend down to 0.5 - 1 m AHD.
This tool can be used for many profiles at a time. The relative position (chainage) of different profiles is unlikely to be relevant to most analyses, however, the
long-term changes in different profiles could be informative. Judgement should be used to assess the suitability of this analysis for comparisons
or other uses.
Contours including the shoreline (0 m AHD), Mean High Water (approximately 0.5 m AHD), or the height of the escarpment (height will vary with beach and profile) are used as
an indicator of beach change.
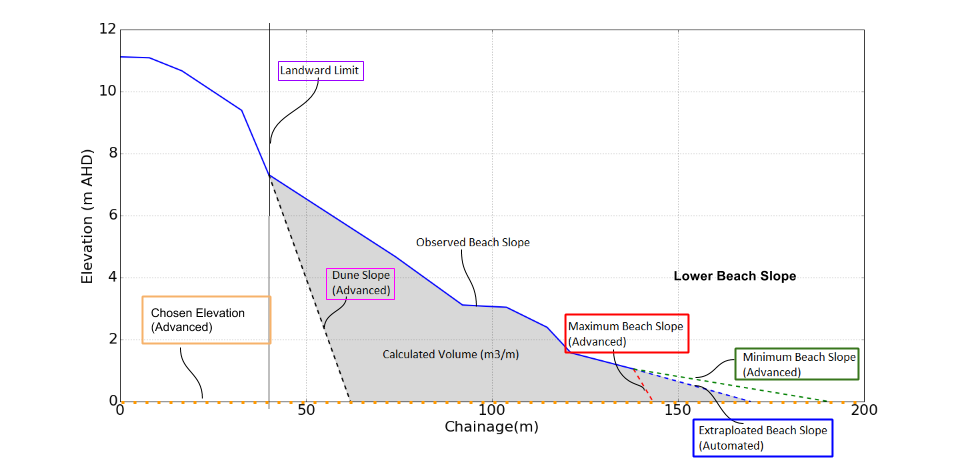
The volume timeseries calculates and displays the volume of material above a chosen elevation at a given location. This tool requires four parameters that can be changed by
the user. Click on the image to enlarge and see an explanation of parameters.
In this tool, the observed data is extrapolated to the chosen elevation if required. By default, it will be at the same gradient as the most seaward
points available in the observed data, unless it exceeds the maximum or minimum beach slope.
To minimise errors and/or exclude changes associated with non-beach related process it may be necessary to adjust the starting point for the volume calculations on a profile by profile basis.
Judgement should be used to assess the suitability of this analysis and the inputted parameters.
| Photogrammetry | The process of using photographs for mapping and surveying |
| Profile | A straight line along the surface of the earth at which observations are made |
| Elevation | Height above the Australian Height Datum, measured in metres |
| Australian Height Datum (AHD) | The reference level used to measure heights against. Approximately equal to mean sea level. More information here |
| Chainage | The distance along a line from an arbitrary starting point |
| Timeseries | A set of values or observations obtained at successive times |
| Contour | A line joining points of equal elevation |
| Accretion | Addition of material (eg sand) over time |
| Recession | Loss of material (eg sand) over time |