NSW Beach Profile Database
Data Questions
The data displayed and provided by the NSW Beach Profile Database (Data) is owned by the Department of Planning, Industry and Environment (DPIE) and hosted by the Water Research Laboratory, University of New South Wales (UNSW).
Use and presentation of the Data on all occasions must include an acknowledgement to DPIE as the owner of the Data and must explicitly identify the following webpage as its source: www.nswbpd.wrl.unsw.edu.au.
The Data was originally prepared by DPIE for internal use, in some cases many years ago and to a lesser standard than may be applied now. The analysis tools provided are generic, and may not be appropriate for use at all locations. The Data is provided on an 'as is' basis and use of the Data is at the user's own risk and expense and DPIE or UNSW make no warranties about the accuracy, reliability, currency or fitness for purpose of the Data. Users will be responsible for any advice provided or other use based on the Data .
The data presented in the NSW Beach Profile Database has been collected by the Department of Planning, Industry and Environment since the 1970's. Most of the survey data has been collected using stereo photogrammetry, however some of the most recent datasets were collected using ground laser scanner, Light Detection and Ranging (LiDAR) and drones.
Photogrammetry is the process of obtaining elevation and positional information from two or more aerial images. Images can be overlayed to produce a three dimensional model of the photographs, traditionally by using a piece of equipment called a Stereoplotter.
Known survey points (known as 'ground control points'), are used to increase and verify the accuracy of the model. This allows extensive mapping, often not feasible by conventional ground surveying techniques.
This database is specifically using the photogrammetry data collected on the NSW Coastline. Over many years, a large number of photogrammetry datasets have been analysed at thousands of cross-sections up and down the NSW coast. This site provides a visualisation of the location of the data that has been collected and processed, as well as providing access to the raw data and a number of basic analysis tools.
The NSW Government has been using aerial photography for mapping since the 1920's. During World War II, extensive aerial images were taken for miltary purposes along significant portions of the NSW coastline. Since then, the NSW government has continued to collect aerial images for various purposes, including coastal planning and management.
The extent of the photogrammetry data on the NSW coast includes Tweed Heads in the far north of the state, down as far south as Eden. Over 120 different beaches have been surveyed using this technique, at over 10,000 different transects. The dataset include around 2,500,000 points that are available in this database.
To explore the locations where photogrammetry data exist, go to the Explore Beaches page.
The data available on this website is point data (easting, northing, chainage, elevation) extracted along pre-select profiles at every beach. This data has already been processed from the aerial images. You cannot select profiles at the locations of your choice, or access the raw aerial photos.
Accuracy of photogrammetry depends primarily on the aerial images. While each image can be assessed individually for accuracy, The general accuracy of photogrammetry data to be:
| Years | Horizontal Accuracy(m) | Vertical Accuracy (m) |
|---|---|---|
| 1920's to 1940's | ± 1 | ± 0.7 |
| 1950's to 1960's | ± 0.5 | ± 0.5 |
| 1970's to 2006 | ± 0.3 | ± 0.3 |
| 2006 to present | ± 0.3 | ± 0.2 |
Photogrammetry, and other modern aerial survey techniques, vary in accuracy depending on the terrain. For example, often dense vegetation prevents the survey from obtaining a ground return. Users can add quality flags to data as they view it, as well as view quality issues flagged by other users. If you believe a point is not accurate due to vegetation or similar problems, please leave a quality flag.
Currently, this site allows access to the photogrammetry raw data, as well as providing a number of useful visualisation and basic analysis tools. These include:
To use these tools, select a location of the Explore Beaches page. To find out more about the analysis tools available, go to the Tools Explanation page.
At the moment, the images are generally held in hard copy and are not available to the public to view. Examples of the images are shown in the panel to the right
When the photos were originally analysed, the data was stored in such a way that only the year of the survey was stored. While the original copies of the images are tagged with the data, the process of digitising this data is still being undertaken. In the meantime, only the year will be available for many data points
For regresssion calculations, which are rates on a yearly basis, dated surveys are converted to a decimal year (eg 1 July 2016 becomes 2016.5) and un-dated surveys remain as an integer year. For this reason, you may see decimal years in the axis or points in the contour or volume plots. Use the cross-section plots provided to obtain the actual dates. Downloaded data will provide the date, if available, or year if not.
Most of the most recent surveys were done using Light Detection and Ranging (LiDAR), ground laser surveys or drone surveys. These modern techniques will generally offer a much higher point density than traditional photogrammetry. For the visualisation of the data, surveys with a point density greater than 1 point every 2 m have been resampled for ease of use. All calculations are done using entire dataset, and downloaded data is not resampled.
When you download cross section data, each point is referenced by the type of survey.
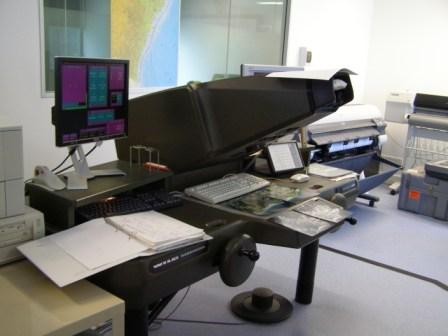
Stereoplotter at DPIE
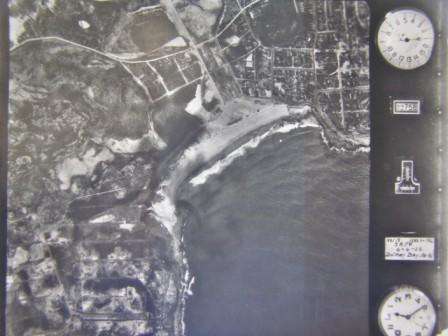
Maroubra, 1929
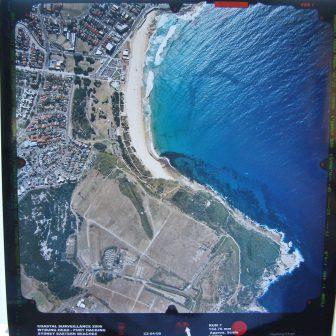
Maroubra, 2006
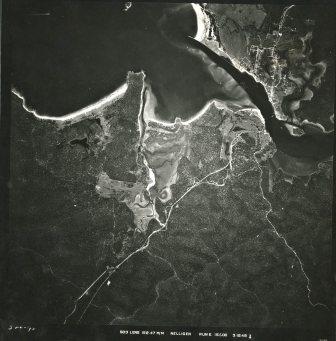
Batemans Bay, 1949
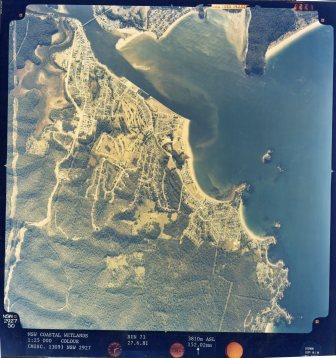
Batemans Bay, 1981
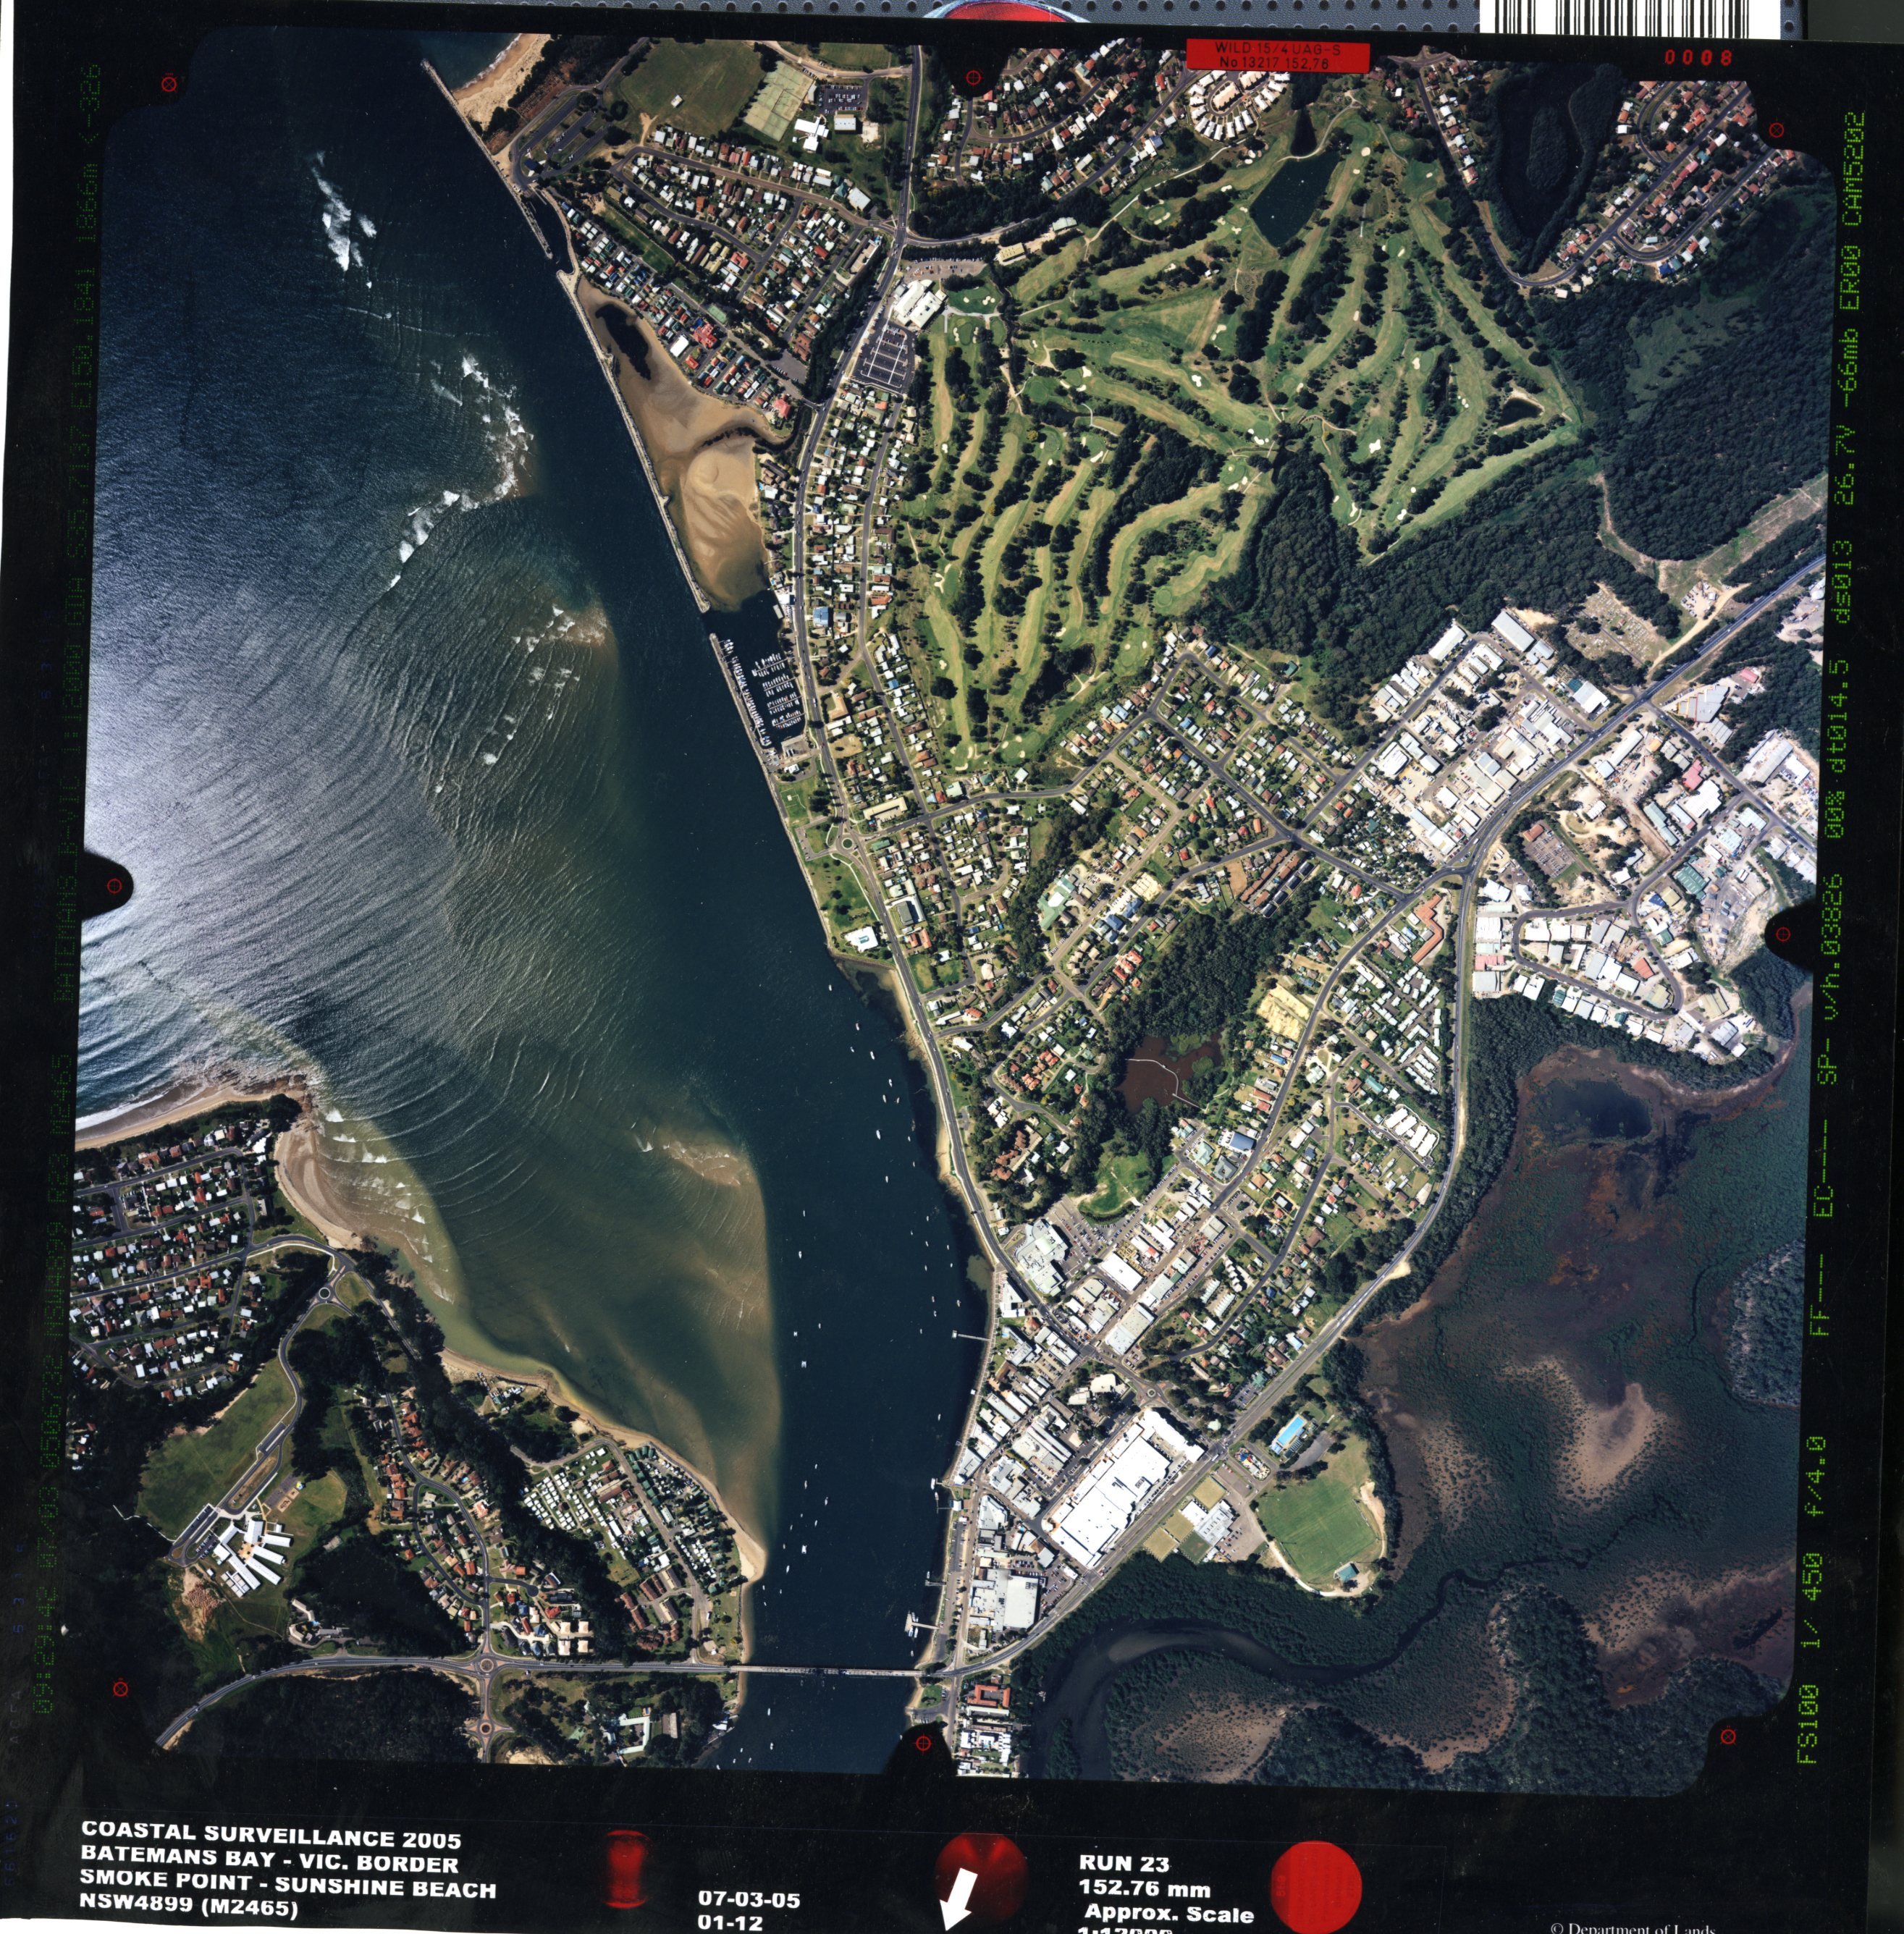
Batemans Bay, 2005